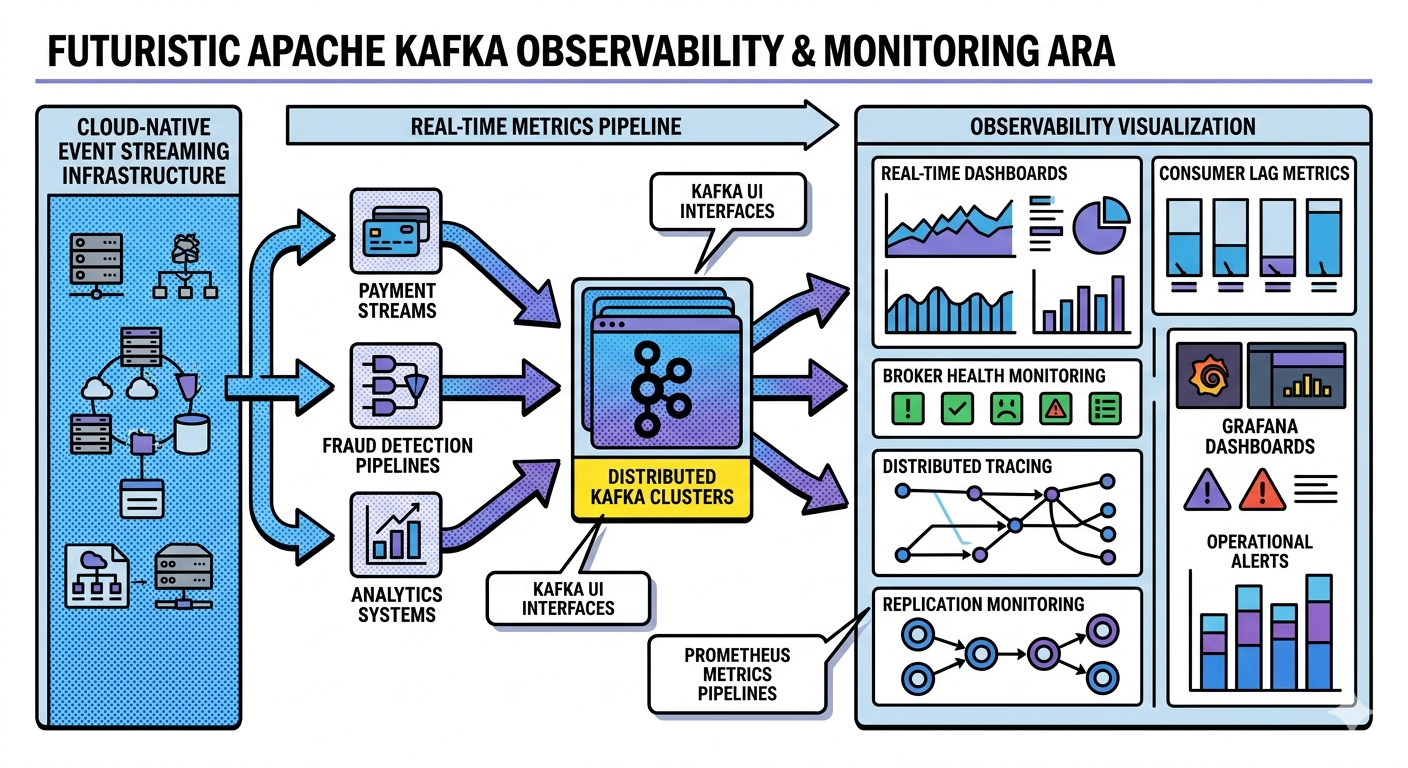
Kafka Observability for Beginners
Monitoring, Debugging, and Understanding Kafka Systems in Real Time
As organizations scale their:
- event-driven architectures
- streaming platforms
- real-time systems
operating:
Apache Kafka
reliably becomes critically important.
Kafka clusters often power:
- payment systems
- fraud detection pipelines
- observability platforms
- analytics infrastructures
- mission-critical business workflows
When something goes wrong:
- transactions may delay
- dashboards may become stale
- fraud alerts may stop
- downstream systems may fail silently
This is why:
Observability is essential in Kafka systems.
Kafka observability helps teams:
- understand cluster behavior
- detect failures
- monitor throughput
- identify bottlenecks
- troubleshoot consumer lag
- maintain operational health
In this article, we will deeply explore:
- what observability means
- why Kafka observability matters
- important Kafka metrics
- logs and tracing
- broker monitoring
- consumer monitoring
- lag monitoring
- dashboards and alerts
- common observability tools
This article introduces the operational side of Kafka systems.
What is Observability?
Observability means:
Understanding the internal state of a system using external signals.
In distributed systems, observability usually includes:
- metrics
- logs
- traces
These help engineers answer:
What is happening?
Why is it happening?
Where is the problem?
Why Kafka Observability Is Important
Kafka systems are:
- distributed
- asynchronous
- highly concurrent
Failures are often:
- subtle
- delayed
- difficult to trace
Without observability:
- problems remain hidden until users complain.
Example Kafka Failure Scenario
Suppose:
- payment events stop processing
Possible causes:
- broker overload
- consumer crash
- network issue
- partition imbalance
- storage exhaustion
- lag buildup
Without observability:
- diagnosing becomes extremely difficult.
Observability in Event-Driven Systems
Event-driven architectures create additional challenges because:
- producers and consumers are decoupled
- workflows are asynchronous
- failures propagate indirectly
Monitoring only APIs is insufficient.
Kafka observability becomes essential.
The Three Pillars of Observability
1. Metrics
Metrics are:
Numerical measurements over time.
Examples:
- throughput
- lag
- latency
- CPU usage
- request rates
2. Logs
Logs are:
Detailed event records.
Examples:
- broker failures
- rebalance events
- connection errors
- authorization failures
3. Traces
Traces track:
Request or event flow across systems.
Useful in:
- microservices
- distributed event pipelines
Why Metrics Matter in Kafka
Kafka clusters process:
- continuous event streams
Metrics help answer:
- Is the cluster healthy?
- Are consumers keeping up?
- Is throughput increasing?
- Are brokers overloaded?
Key Kafka Metrics
Important Kafka metrics include:
| Metric | Meaning |
|---|---|
| Consumer Lag | Delayed consumption |
| Throughput | Messages/sec |
| Request Latency | Broker responsiveness |
| Disk Usage | Storage consumption |
| Partition Count | Scalability distribution |
| Under-Replicated Partitions | Replication health |
| ISR Shrink Events | Replica instability |
Consumer Lag — One of the Most Important Metrics
Consumer lag means:
Produced messages
minus
Consumed messages
Example:
Latest Offset = 10000
Consumer Offset = 9500
Lag = 500
Why Consumer Lag Matters
High lag indicates:
- slow consumers
- overloaded systems
- downstream bottlenecks
Consequences:
- stale dashboards
- delayed fraud detection
- slow notifications
Lag is one of the most monitored Kafka metrics.
Throughput Monitoring
Throughput measures:
- messages processed per second
- bytes transferred
- producer/consumer activity
Example:
500,000 events/sec
Throughput monitoring helps capacity planning.
Broker Health Monitoring
Kafka brokers must be monitored for:
- CPU usage
- memory usage
- disk I/O
- network throughput
- JVM metrics
Brokers are the foundation of Kafka clusters.
Why Disk Monitoring Is Critical
Kafka stores:
- durable event logs
If disk fills up:
- brokers may fail
- retention problems occur
- cluster instability increases
Disk observability is extremely important.
Replication Health Monitoring
Kafka uses:
- partition replication
Important metrics include:
Under-Replicated Partitions
This indicates:
- replicas falling behind leader
Potential causes:
- broker failures
- slow disks
- network issues
ISR Monitoring
Kafka tracks:
In-Sync Replicas (ISR)
Healthy replication requires:
- replicas staying synchronized
ISR shrinkage may indicate:
- cluster instability
- performance bottlenecks
Producer Monitoring
Producer metrics include:
- send latency
- retry counts
- error rates
- batch sizes
High producer retries may indicate:
- overloaded brokers
- networking issues
Consumer Monitoring
Consumers should be monitored for:
- lag
- poll frequency
- processing latency
- rebalance frequency
- failure rates
Consumer health directly affects:
- streaming pipelines
- business workflows
Rebalance Monitoring
Frequent rebalances may indicate:
- unstable consumers
- scaling issues
- deployment problems
Rebalances temporarily pause processing.
Excessive rebalancing can become operationally expensive.
Kafka Logs
Kafka brokers generate logs containing:
- startup information
- replication events
- leader elections
- errors
- warnings
Logs are critical for:
- troubleshooting
- forensic analysis
Example Broker Log Events
Examples:
Broker disconnected
Leader election triggered
Partition reassigned
ISR shrunk
These help engineers diagnose issues.
Distributed Tracing in Kafka Systems
Modern Kafka systems increasingly use:
Distributed tracing.
Tracing follows:
- requests
- events
- workflows
across:
- microservices
- event pipelines
Why Tracing Matters
Suppose payment processing slows down.
Tracing helps identify:
Which service caused delay?
Critical in:
- distributed architectures
- asynchronous workflows
Common Kafka Observability Tools
Popular Kafka observability tools include:
| Tool | Purpose |
|---|---|
| Grafana | Dashboards |
| Prometheus | Metrics collection |
| AKHQ | Kafka UI |
| Kafka UI | Topic visualization |
| Jaeger | Distributed tracing |
| OpenTelemetry | Observability instrumentation |
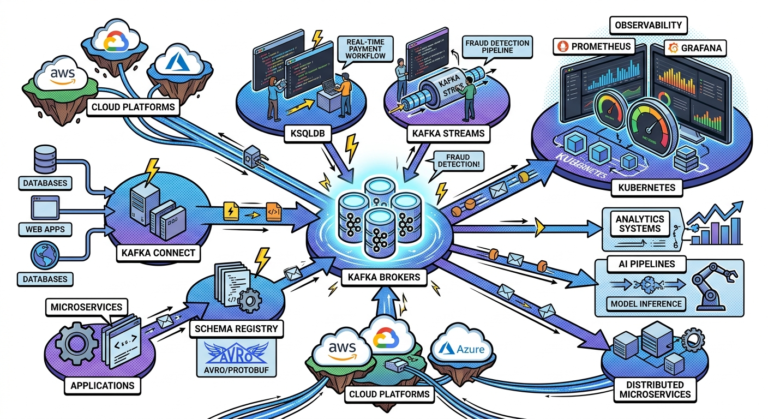
Grafana Dashboards
Grafana
is widely used for:
- Kafka dashboards
- real-time metrics visualization
- operational monitoring
Grafana visualizes:
- lag
- throughput
- broker health
- JVM metrics
Prometheus Metrics Collection
Prometheus
collects:
- Kafka metrics
- broker metrics
- consumer metrics
Prometheus stores:
- time-series operational data
Kafka UI Tools
Popular Kafka UIs include:
- AKHQ
- Kafka UI
These provide visibility into:
- topics
- partitions
- consumer groups
- offsets
- lag
Useful for:
- debugging
- operational management
Alerting Systems
Observability is incomplete without:
Alerts.
Examples:
- lag spikes
- broker failures
- disk exhaustion
- ISR instability
Alerts help teams respond quickly.
Example Kafka Alerts
Consumer Lag > 50,000
Disk Usage > 90%
Broker Offline
Under-Replicated Partitions > 0
Why Observability Is Crucial in Production
Kafka systems often power:
- mission-critical business workflows
Without observability:
- failures become expensive
- downtime increases
- troubleshooting slows dramatically
Operational visibility becomes essential.
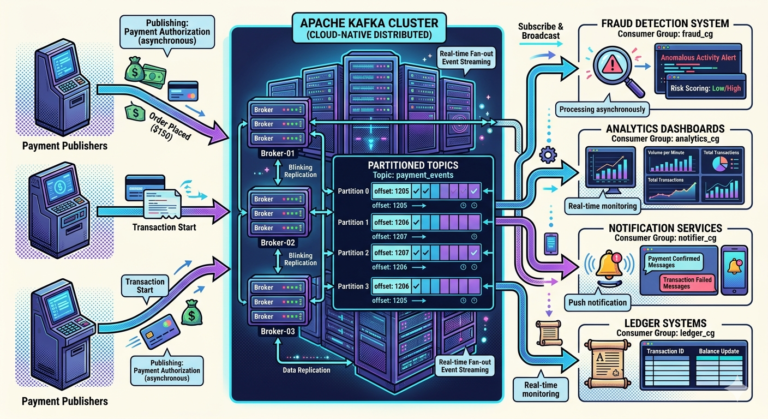
Real-Time Monitoring Example
Suppose payment traffic suddenly spikes.
Observability dashboards reveal:
- throughput increase
- consumer lag growth
- broker CPU pressure
Teams can:
- scale consumers
- add brokers
- rebalance workloads
before outages occur.
Capacity Planning with Observability
Observability helps teams plan:
- partition scaling
- broker expansion
- retention policies
- consumer scaling
without guesswork.
Why Kafka Systems Require Proactive Monitoring
Kafka clusters often appear healthy until:
- lag accumulates
- storage fills
- replication weakens
Good observability enables:
- proactive operations
instead of: - reactive firefighting
Observability in Cloud-Native Kafka
Modern Kafka deployments increasingly run on:
Kubernetes
Cloud-native observability also includes:
- pod metrics
- container health
- orchestration visibility
Common Beginner Mistakes
Mistake 1
Monitoring only brokers
Consumers and applications matter equally.
Mistake 2
Ignoring lag until failures occur
Lag is often the earliest warning signal.
Mistake 3
Relying only on logs
Metrics and traces are equally important.
Mistake 4
No alerting thresholds
Monitoring without alerts reduces operational value.
Why Observability Became Essential for Kafka
Kafka powers:
- distributed event pipelines
- streaming analytics
- financial systems
- operational infrastructures
These systems require:
- reliability
- scalability
- operational visibility
Apache Kafka
observability helps organizations maintain:
- healthy clusters
- stable consumers
- reliable event pipelines
- resilient real-time architectures
Key Takeaways
Kafka observability helps teams:
- monitor cluster health
- track consumer lag
- diagnose failures
- manage scalability
- maintain reliable event pipelines
The three pillars of observability are:
- metrics
- logs
- traces
Important Kafka metrics include:
- lag
- throughput
- replication health
- broker performance
Popular observability tools include:
- Grafana
- Prometheus
- AKHQ
- Kafka UI
Strong observability is essential for operating:
Apache Kafka
reliably in production-scale distributed systems.